From discovering the oncofetal ecosystem to advancing spatial multi-omics, Ankur Sharma explains how measuring RNA and protein in the same tissue section reveals biological insights that would be missed by either modality alone
Most spatial multi-omic studies rely on serial tissue sections to assess RNA and protein. But because serial sections represent adjacent rather than identical tissue, cellular features do not align perfectly between modalities, requiring researchers to infer relationships between gene expression and protein function.
In a recent webinar, Ankur Sharma demonstrates how a same-slide workflow combining spatial transcriptomics and Imaging Mass Cytometry™ (IMC™) technology enables researchers to measure RNA and protein in the same cell, providing a more accurate view of tumor biology. This approach was published in Cancer Research Communications, in which Sharma and colleagues describe an integrated workflow for sequential RNA and protein profiling on the same FFPE tissue section.
 As the leading researcher who discovered the oncofetal ecosystem in liver cancer, Sharma is the Laboratory Head at the Garvan Institute of Medical Research in Australia. His research focuses on oncofetal reprogramming in cancers, examining how cellular programs that are active during fetal development re-emerge in cancer. “We don’t require these cells for day-to-day life, homeostatic functions, but they reappear in cancer because they may provide some functions such as high proliferation, ability to migrate, as well as ability to evade immune response,” Sharma says. These fetal-like cells provide a unique opportunity to improve our understanding of cancer biology, discover new biomarkers and uncover therapeutic strategies.
Can spatial patterns of the oncofetal ecosystem help predict outcomes?
Sharma and his team have leveraged spatial omics to investigate how fetal-like cell states are associated with important prognostic and predictive insights in liver cancer. This has led to DEFINERx050, a clinical trial evaluating oncofetal cells as biomarkers of immunotherapy response in liver cancer. In addition, Sharma and collaborators are building ASTRA (Asia-Pacific Spatial Translation Research Alliance), a pan-cancer spatial atlas that aims to broaden the scope beyond liver cancer by profiling more than 3,000 tissues across 15 tumor types. By mapping how fetal-like cells are organized in developing tissues and how these spatial patterns reappear in tumors, the team aims to identify biological features associated with immunotherapy response.
An integrated spatial transcriptomic and IMC workflow in FFPE sections
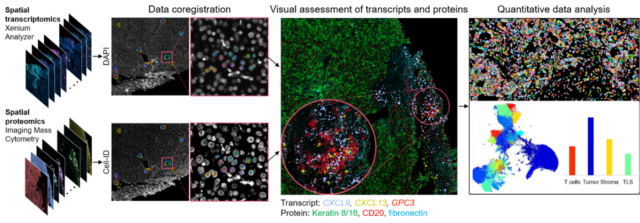
Sharma and his team combined spatial transcriptomics (Xenium, 10x Genomics) and spatial proteomics (Hyperion™ XTi Imaging System, Standard BioTools) on the same FFPE slide. The workflow leveraged a 462-gene Xenium panel and a 43-protein IMC panel, enabling researchers to assess both cellular identity and function within the same tissue context. Sharma notes that while the data is presented using smaller gene panels, his team has performed this workflow using larger 2,000-plex gene panels. By coregistering the Xenium and IMC datasets using DAPI and nuclear landmarks, RNA and protein measurements can be overlaid at single-cell resolution, allowing researchers to directly compare gene expression and protein localization in the same cell.
A critical question was whether the Xenium workflow would compromise downstream protein detection. To test this, the research team compared IMC data generated from sections that had undergone Xenium processing with sections analyzed by IMC technology alone. Across multiple markers and cell types, protein staining intensity and image quality remained highly consistent, demonstrating that protein information was preserved following spatial transcriptomic analysis.
“IMC is a very robust technology where you can just take a sample which has spent one week in Xenium and you can still get all the protein information which you care about.”
This sequential workflow enables researchers to obtain rich transcriptomic data without sacrificing protein measurements, providing a more complete view of cellular state and function from the same tissue section.
RNA provides the blueprint, but protein reveals function: Lessons from the same cell
Throughout the talk, Sharma demonstrates how combining RNA and protein measurements in the same cell provides biological insights that would be missed by either modality alone. Using the β-catenin signaling pathway as an example, he showed that tumors with similar transcript and protein abundance can exhibit very different biology depending on whether β-catenin is localized to the nucleus or remains in the cytoplasm. Nuclear β-catenin was associated with stem-like and mesenchymal gene programs, despite comparable levels of transcript and protein expression. In this example, Sharma illustrates that protein localization can have a profound impact on cellular function, even when RNA and protein abundance appear similar, highlighting the limitations of relying on transcript data alone.
The same principle extended to the tumor microenvironment. By integrating RNA and protein data, Sharma’s team was able to more deeply characterize complex immune structures such as tertiary lymphoid structures (TLS), where some markers were best resolved at the RNA level and others through protein expression. The ability to seamlessly move between modalities provided a richer view of tissue organization and cellular interactions.
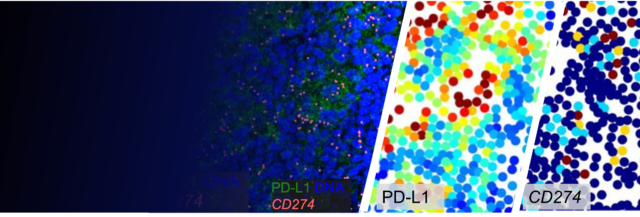
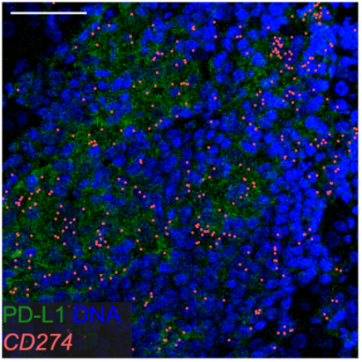
The approach also has important implications for research. Examining immune checkpoint molecules revealed that transcript and protein levels do not always correlate. In the case of PD-L1, protein expression was readily detected on macrophages despite relatively low transcript levels. The same pattern held for TIM-3 on dendritic cells and IDO1 on stromal cells, with protein consistently easier to detect than the corresponding transcript – underscoring the value of measuring both modalities to identify the cellular source of key biomarkers and better understand mechanisms that may influence response to immunotherapy.
By measuring both in the same cell, researchers can connect gene expression, protein activity and cellular behavior to gain a more complete understanding of disease biology.
Read the publication in Cancer Research Communications: An integrated spatial multi-omics workflow for sequential RNA and protein profiling in FFPE tumor tissue
Read the poster